
Formula 1 Fanatics Blog Project
Formula 1: Analyzing F1 Beyond the Track
Abstract
Our blog delves into the world of Formula 1 (F1), the pinnacle of international racing, by offering a fun and interactive take on its analytics. F1 has and continues to be a booming form of entertainment for viewers all across the world, drawing fans through its exhilarating competition in high-speed racing. The world wide championship sport introduces an abundance of data, and we thought it would be super interesting to present and analyze a range of aspects in the F1 world from driver and constructor rankings to Grand Prix races to general reception/news! We explore the sport’s rich history and performance from years 1950-2024 through visualizations, including word clouds, network graphs, and interactive maps. This is for both F1 enthusiasts and curious newcomers!
Introduction
Purpose
Formula 1 (aka F1) has and continues to be a booming form of entertainment for viewers all across the world, drawing fans through its exhilarating competition in high-speed racing. It is a world wide championship sport that is introduces an abundance of data, and we thought it would be super interesting to present and analyze a range of aspects in the F1 world from driver and constructor rankings to Grands Prix locations to general news/events. The purpose of this project is to hence provide an educational or informational blog to help newcomers become familiar with the fascinating world of F1!
Background & Data
Formula 1 is the highest-class of auto racing with single-seats since beginning in the 1950s, and is sanctioned by the Fédération Internationale de l’Automobile (FIA). The term “Formula” in its name refers to a set of rules that the participants and their car must follow in and beyond races. A season in F1 consists of a series of races, known as Grand Prix, which takes place at circuits worldwide.
The data used in this blog project is the Formula 1 World Championship (1950 - 2024) dataset taken from Kaggle (available for public use)(Rao 2020). It consists of information on F1 races, drivers, constructors, circuits, lap times, standings, among many others from 1950s to the latest 2024 season. The data was collected by manually downloading 7 out of 14 existing CSV files to be wrangled and used for our visualizations. We also web scraped the content on Wikipedia’s List of Formula One Grands Prix to create the word clouds in Figure 7 through Figure 10.
Key F1 Terms
Constructors: a team or company that is responsible for building and running their own cars for F1 races. There are atleast two drivers and at most four drivers belonging to every team across a season (year).
Podium: platform/prizes for the drivers that finished a race in one of the top three positions (1st - 3rd place)
Grand Prix (pl. Grands Prix): a race in F1
- a short race before Grands Prix is called a sprint race
Season: a series of Grand Prix races conducted over a period of time, typically around a year
The point system in the F1 World Championship determines the winner of any given season.
- Drivers who finish top 10 score points for both themselves and their team.
- At the end of a season, the driver and team champions are the ones with the most points
- in a Grand Prix,
- 1st place gets 25 points
- 2nd place gets 18 points
- 3rd place gets 15 points
- 4th -> 12 points
- 5th -> 10 points
- …
- 9th -> 2 points
- 10th place gets 1 point
Current F1 Standings Breakdown
Since the 1950s to the recent 2024 season, there have been lots of discourse surrounding who are the best constructors and/or drivers in all of Formula 1. However, data analysis on the number of total wins (1st place) and podiums (1st - 3rd place), as well as the total cumulative points scored across the careers of all drivers, will tell us who truly are the top performers.
Below are interactive bar plots created using plotly that display the top F1 drivers and constructors based on number of points they have accumulated in all Grands Prix from 1950s onward. This is based on the point system in Formula 1, which determines the final rankings for the world championships. The points were summed according to the final standings per race, such that the points earned mapped to the position that they ended in (e.g 1st place mapped to 25 points). The total wins and podiums throughout all Grands Prix since the 1950s were also counted and displayed below. Since the ranking in F1 is based on a specific point system, the top drivers and constructors are ordered in descending order according to the number of total points they accumulated in F1 championship races from the entire trajectory of their career.
Top F1 Performers of All Time
Interactivity Tip!
Click each metric (total wins, podiums, or points) in the legend to interact with the plots! (The bars showing the total cumulative points of all time for both drivers and championship is currently hidden for aesthetic purposes)
The top F1 drivers of all time are Lewis Hamilton, Michael Schumacher, and Fernando Alonso, accumulating a total of around 5.9k, 4.8k, and 3.6k points respectively in championships over the years since the 1950s. Lewis Hamilton has won 233 Grand Prix races and although Vettel won more races and podiums than Alonso, it is clear that Alonso racked up more points across all seasons throughout his career, which places him above Vettel in all time performance. Also, the difference between each top 10 driver is not significantly drastic, although the margins for points have been extremely close for Alonso and Vettel, as well as Piquet and Lauda.
Ferrari, McLaren, and Williams are in the lead for the best performing F1 constructors of all time since the 1950s. It is interesting to see that many teams on this plot are no longer the top performing or even the most popular among F1 fans in the recent years/championships.
The plots also indicate the heavy weight the point system holds for winning championships over both wins or podiums in Formula 1, since those with the highest points don’t always hold more wins and/or podiums than those lower on the list.
2024 World Championship Standings
Which drivers are thriving in the most recent season?
To get an overview of which drivers are dominating the current 2024 championship, we created a plot below using plotly to display the cumulative points earned from each driver sequentially, starting from the first Grand Prix of the season, Bahrain Grand Prix to the most recently recorded Grand Prix (in the dataset), British Grand Prix. These points include those earned in Sprint (Qualifying) races on top of Grands Prix.
Interactivity Tip!
Drag across the bar on the bottom of the plot to adjust the timeline view of specific Grands Prix!
It is evident that Max Verstappen has dominated the drivers grid from the very start of the 2024 World Championship season and throughout every Grand Prix until the very end. This is followed by Lando Norris in second and Charles LeClerc in third. The gap of points between Verstappen and second place driver Norris is pretty large and creates little room for competition for championship winner. However, the battle for second place appears to have been extremely close between Norris and Leclerc with only a 6 point gap after the British Grand Prix. It has not been looking great for Guanyu Zhou, a new driver that has failed to gain any points from the start until July at the British Grand Prix.
Grand Prix Circuits
Where have F1 races been held over the years?
There have been a plethora of Grand Prix races, each at different locations across the world. The map below displays the locations of each Grand Prix circuit as well as the number of races that took place since the 1950s.
Methodology
The map was created using the leaflet package by plotting the longitude and latitude coordinates of each city in which a circuit was held. Each Grand Prix circuit was aggregated to calculate the total number of races held at that location over the years, represented on the map through varying circle sizes, with a gradient color scheme applied to make it visually intuitive. The map includes multiple layers for user interaction:
- Pins: Represent the exact location of each circuit, providing a quick visual reference for the cities where Grand Prix events have occurred.
- Circles: Represent the number of races held at each location, with larger circles indicating more races. A color gradient further distinguishes between circuits with fewer and greater numbers of races.
Interactivity Tip!
Click the circle markers to see the number of races that have been held at each Grand Prix circuit location since the 1950s (disable Location Pins layer)!
Interpretation
The map shows that the majority of Grands Prix have been held in Europe, as indicated by the large cluster of circle markers and a darker red colors that signify a higher number of races have taken place. The majority of Grand Prix races have taken place in Europe, with the most number of races, 74, being held in Monza, Italy in the Italian Grand Prix races. Although there have been a handful of races held all over America, the max races held is only 20 in New York. There have been very few Grands Prix held in Africa, specifically South Africa, and South Asia (e.g India). Also, regions that have held no Grands Prix are Central Asia, Eastern and Central Africa, North and Western South America, among others, perhaps due to less strong economies compared to those that are able to finance the cost of hosting these races.
Network of Circuits
What circuits are more frequently chosen to host?
The purpose of this network analysis is to determine the frequency of which countries have been Grand Prix hosts through the years as a supplement for the locations map. For both visualizations, the nodes represent each country that has historically hosted a Grand Prix. While Figure 5’s edges(arrows) point to the direction of the next country that hosted a Grand Prix after (within Europe), Figure 6’s edges connect to all the countries that have hosted before or after each country (e.g. India has hosted a Grand Prix after Korea and Japan).
The network in Figure 5 was created using the ggraph package and Figure 6 was created using simpleNetwork. Both nodes and edges(arrows) were color-coded for easier access.
Table 1 shows a summary table of the most popular host and destination pairings of all time in Grand Prix history.
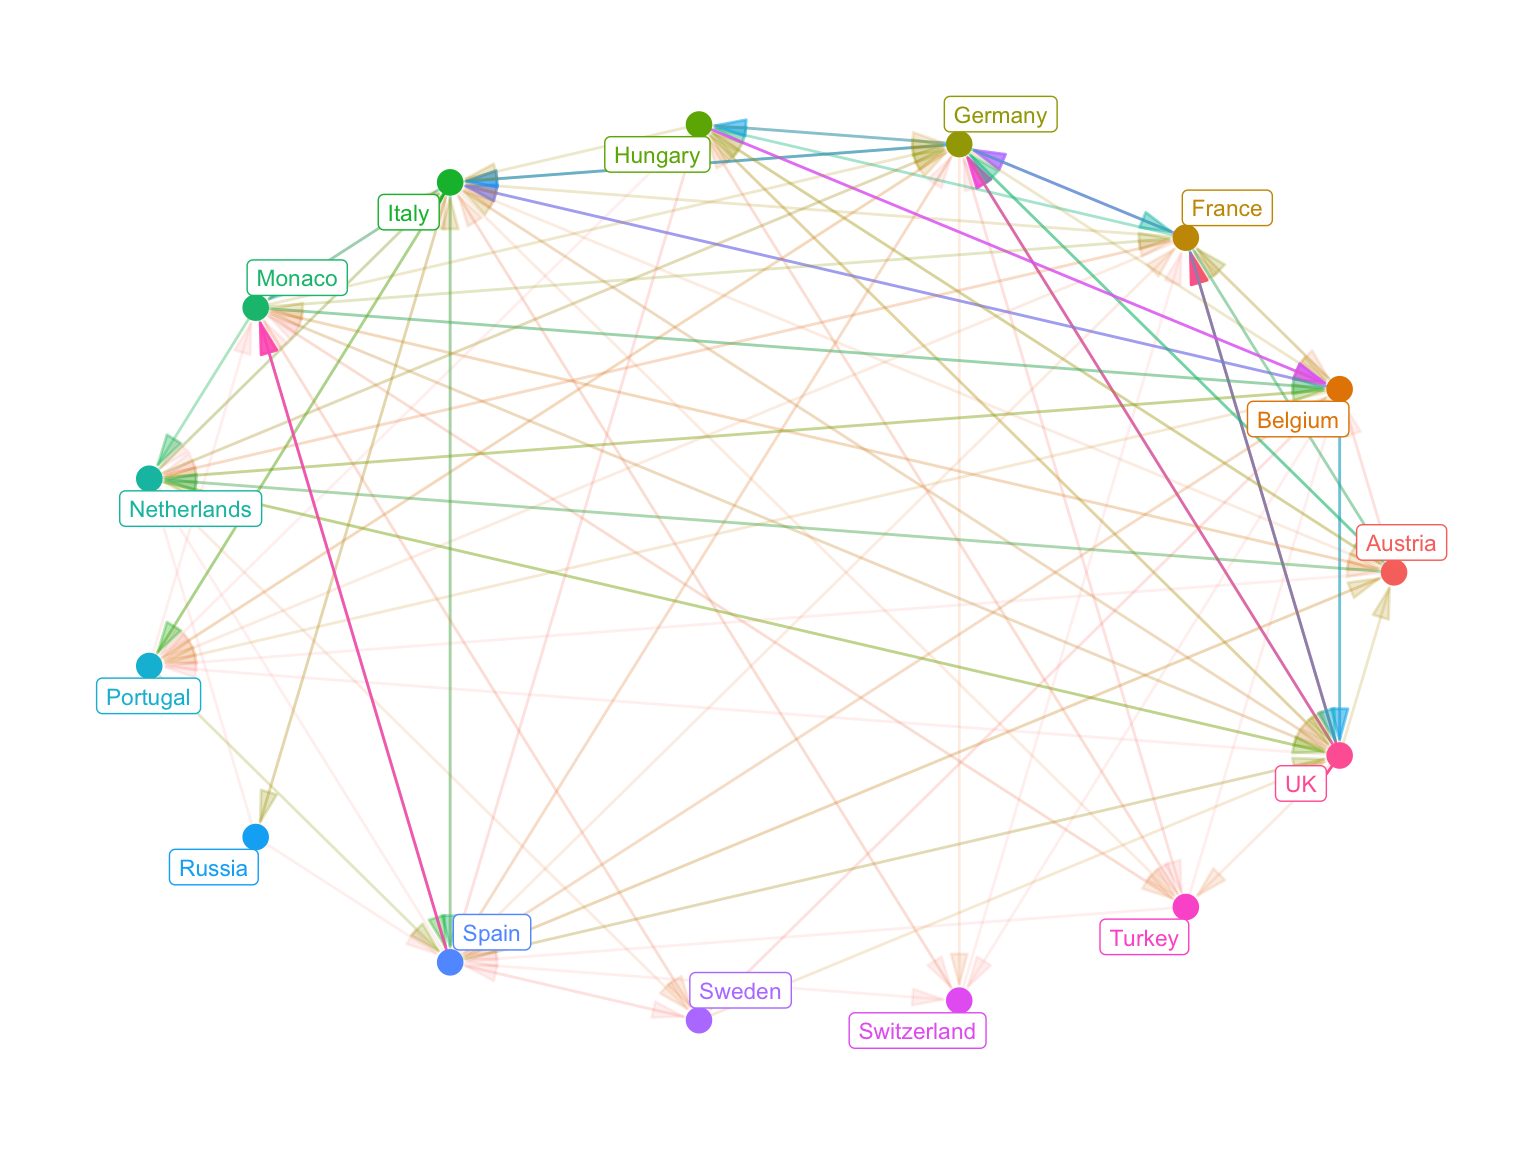
As seen later in Table 1, the most popular Grand Prix hosts are all located in Europe. Therefore, this network shows the relationships between all the European hosts.
Another thing to note is the opacity of each arrow. An opaque arrow represents 20+ visits per route (e.g. there has been at least 20 races held in Monaco after a race has been held in Spain).
This network shows the overall connections between all Grand Prix circuits’ locations. Try to pull a node apart and see what happens!
| Host | Destination | Total Visits |
|---|---|---|
| UK | France | 26 |
| Spain | Monaco | 23 |
| UK | Germany | 22 |
| Hungary | Belgium | 21 |
| France | Germany | 19 |
| Belgium | Italy | 18 |
| Germany | Italy | 17 |
| Belgium | UK | 14 |
| Germany | Hungary | 14 |
| Italy | Argentina | 13 |
Interpretation
Figure 5 and Figure 6 networks show the relationships and popularity of Grand Prix locations based on the total number of visits to each circuit.
Figure 5’s edges are connected by arrows that form “florets” around a popular destination like the UK, Spain, and Belgium. While it is not entirely clear which circuit came first due to ggraph and raw data restrictions, the visualization shows the general trend between European countries.
Figure 6’s connect each host and destination without external context, which simply highlights the pure connections between countries.
Lastly, Table 1 shows the top 10 most popular host and destinations of all time. It shows that, cumulatively, the most popular Grand Prix host is the UK, while the most popular destination after the UK is France.
News/Events in the F1 World
Word Clouds for F1 Grands Prix
We conducted a text analysis and created four word clouds representing iconic Grands Prix from around the world for the purpose of uncovering insights into the thrilling world of F1! Instead of exploring lengthy Wikipedia articles with overwhelming information, these word clouds provide a fun, engaging, and digestible way to highlight key elements—such as locations, star drivers, and significant incidents—across various races. The word clouds give insights into each of the races and, together, offer a complete picture of the Formula 1 world, especially for those just getting into Formula 1.
Data Sources:
The data used to create the word clouds from Wikipedia’s List of Formula One Grands Prix. This page contains a table listing different Grands Prix along with links to their Wikipedia articles. We scraped the text content from each of these articles to create the world cloud for each of the races.
Methodology:
The word clouds for the F1 Grands Prix were created using an approach involving web scraping, text cleaning, and visualization. Below is an overview of our methodology:
Web Scraping: The text data for each race was scraped directly from Wikipedia using the
rvestpackage. This involved navigating the main Wikipedia page containing links to all the Grands Prix, scraping the table to extract the names and links to each Grand Prix, looping through the links to extract the text body from their corresponding pages, and storing the data in a tibble object for further analysis.Text Cleaning: To prepare the text data for analysis, irrelevant elements such as digits, punctuation, and stop words (common words like “and”, “the”, etc., which add little value to word clouds) were removed using the
stringrandtidytextpackages. Additional terms like “Grand Prix,” “races,”, “Formula 1/F1” and “championship” were also removed to highlight the unique context of each race because these are common terminologies in the F1 world.Tokenization and Word Counts: The cleaned text was tokenized into individual words, and their frequencies were calculated using the
tidytextpackage.Visualization: Using the
ggwordcloudpackage, word clouds were created to visually represent the relative frequencies of the words. Larger words indicate higher frequencies, offering a quick overview of key topics and themes in each Grand Prix.
Results & Analysis:
So…what is happening in the F1 world?
To answer this question, we generated word clouds and chose four with some significant words to note below. These word clouds not only offer pretty visuals but also reveal to us key information about the iconic races that define the world of F1. Observe the word clouds and learn some interesting facts about each of the races.
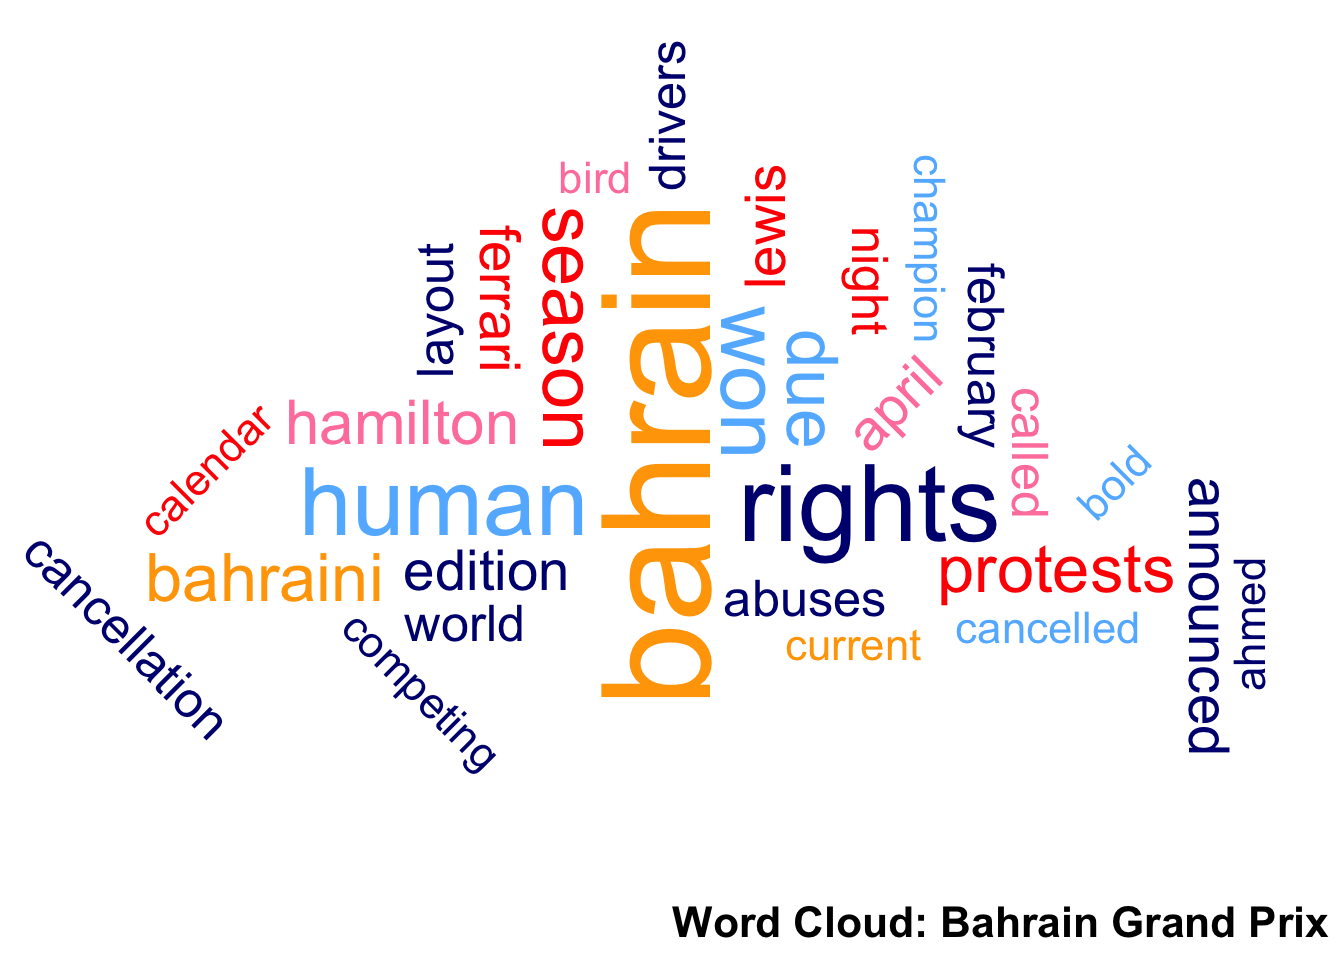
The words ‘bahrain’, ‘human rights’, ‘protests’, and ‘cancelled’ paint a vivid picture of the controversy surrounding the Bahrain Grand Prix. The Grand Prix, held at the Bahrain International Circuit, faced criticism and disruptions due to protests about human rights violations in the region. Many races were also cancelled due to the protests. This Grand Prix is remembered for its political and social backdrop as much as its racing.
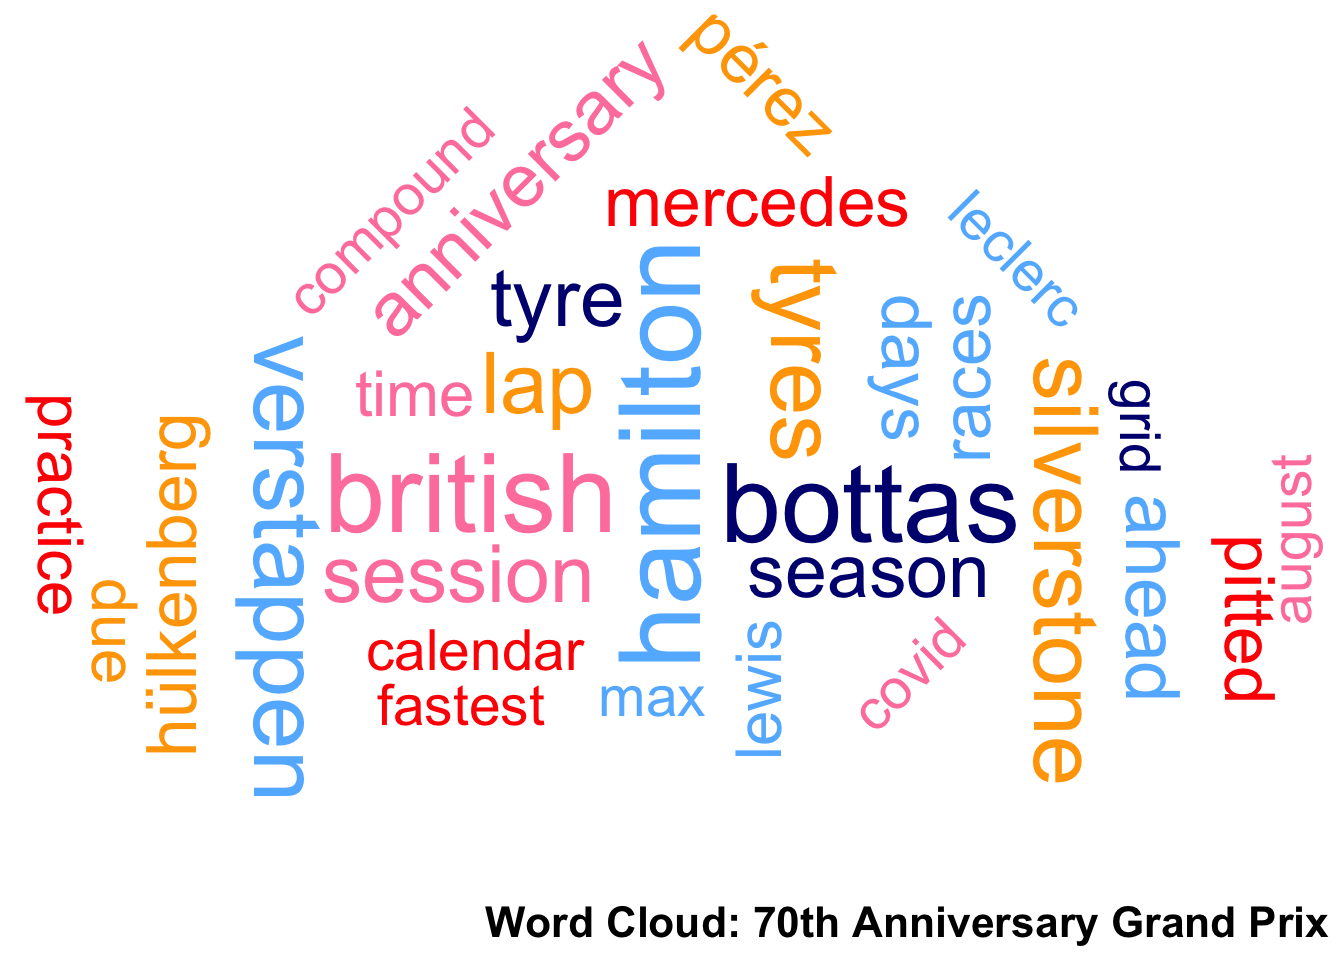
In this word cloud, ‘hamilton’, ‘bottas’, ‘mercedes’, ‘verstappen’, ‘tyre’ (note: ‘tyre’ is the British spelling of ‘tire’) and ‘compound’ are some words that catch the eye and tell the story of the 70th Anniversary Grand Prix. A word that stands out in this word cloud is covid which is prominent because this was a Grand Prix that was held after the COVID-19 pandemic hit, which was a big source of concern for the F1 drivers and management alike. Hamilton, Bottas and Verstappen are prominent F1 drivers who featured in battles in this Grand Prix. Interestingly, the two Mercedes drivers, Hamilton and Bottas, faced tyre overheating and blistering, which allowed Max Verstappen to capitalize on a superior strategy and win on harder compounds. It is interesting to note that though Hamilton did not win first place, his name appears at the same frequency as Verstappen, indicating that Hamilton was a fan favorite.
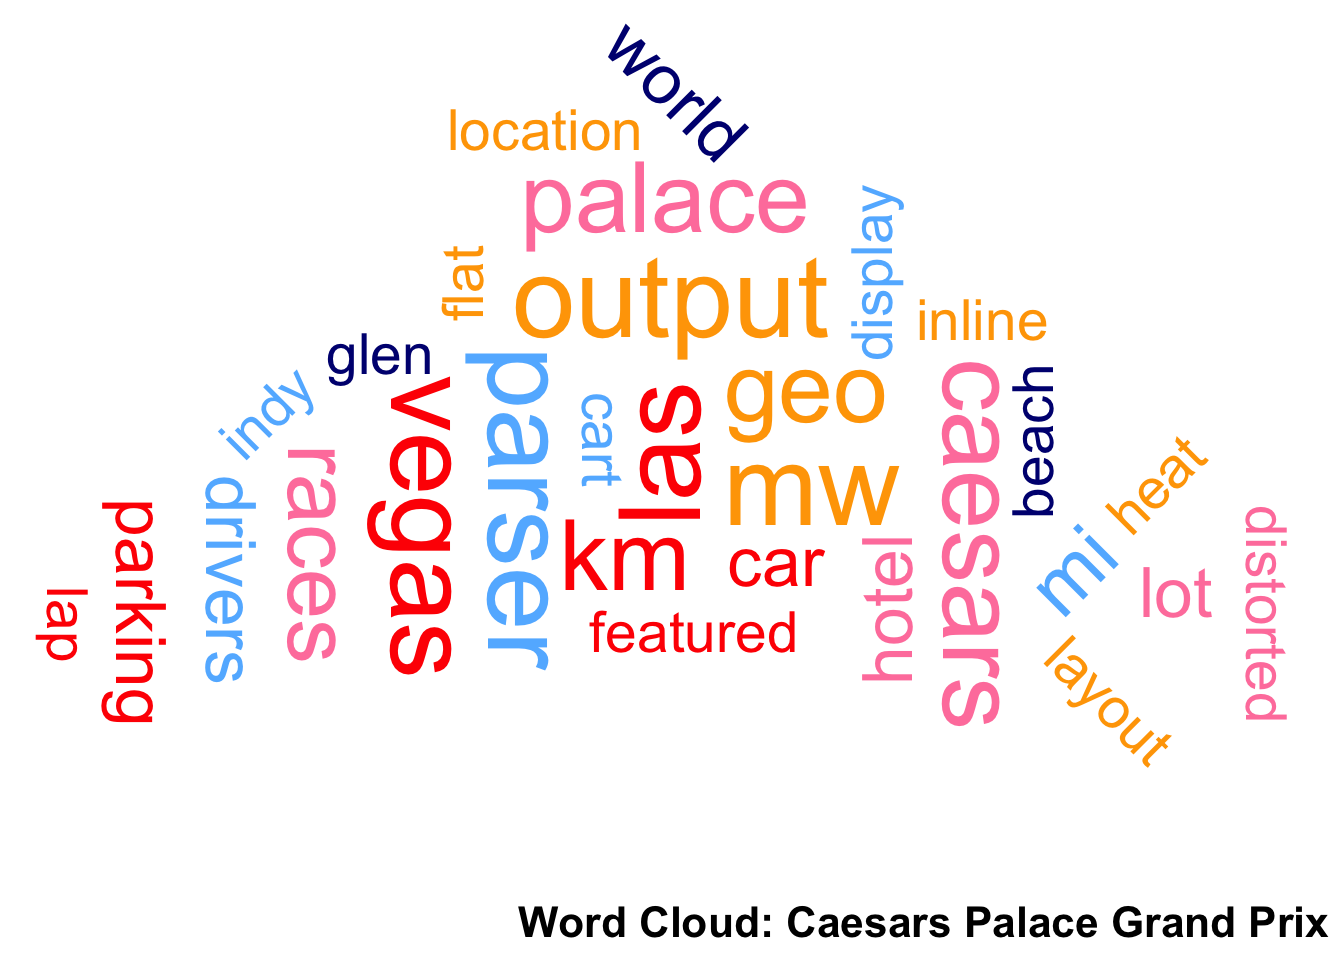
In this word cloud, terms like ‘las vegas’, ‘palace’, ‘parking’, and ‘heat’ define the unique setting of the Caesars Palace Grand Prix. The race was held in the parking lot of the Caesars Palace Hotel in Las Vegas, a unique and unconventional venue for Formula 1. The heat and flat circuit layout presented challenges for drivers, making it one of the more unusual races in F1 history. Due to its unique appeal, it remains a curiosity in the sport’s timeline.
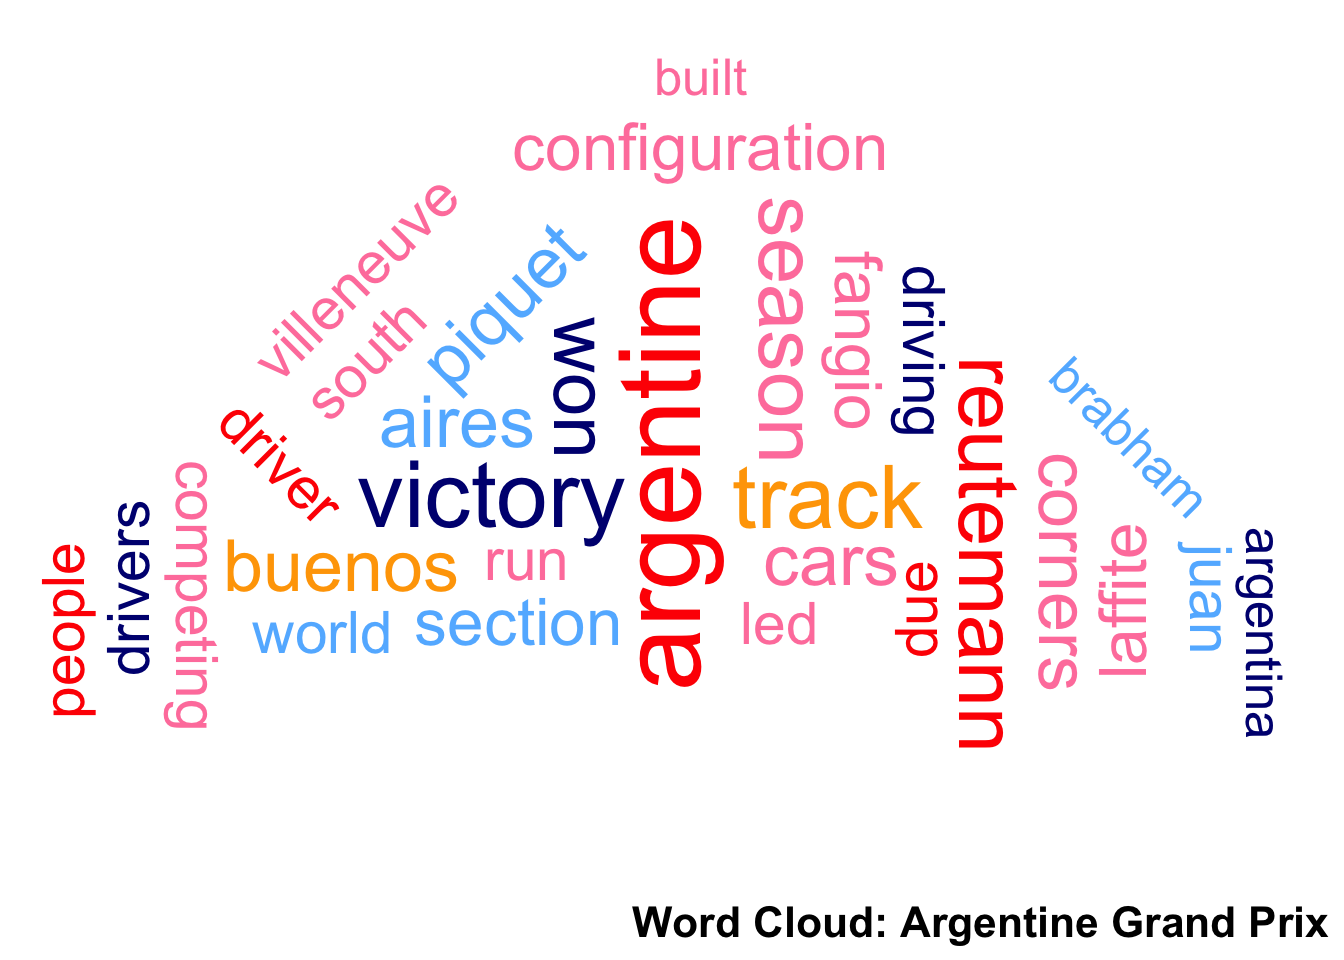
In this word cloud, words like ‘argentine’, ‘victory’, ‘reutemann’, and ‘buenos aires’ tell the story of the Argentine Grand Prix. The race was held in Buenos Aires, as highlighted by the location name. Carlos Reutemann, the Argentinian driver, stands out as a key figure, securing a notable victory on home soil, bringing immense pride to the local fans. The layout of the circuit, known for its challenging ‘corners’ and configurations, is another defining feature of this event.
The word clouds reveal the unique stories behind each iconic F1 Grand Prix. The Bahrain Grand Prix (Figure 7) is defined by terms like ‘human rights’, ‘protests’, and ‘cancelled’, reflecting the socio-political controversies surrounding the event due to protests in the region. The 70th Anniversary Grand Prix (Figure 8) stands out for words such as ‘hamilton’, ‘bottas’, ‘verstappen’, and ‘tyre’, highlighting strategic battles and Max Verstappen’s victory over Mercedes due to superior tyre strategy. The Caesars Palace Grand Prix word cloud (Figure 9) highlights its unconventional circuit with words like ‘las vegas’, ‘palace’, and ‘parking lot’, reflecting its unique venue and the physical challenges it posed due to heat. The Argentine Grand Prix (Figure 10) celebrates local pride, with terms like ‘reutemann’, ‘victory’, and ‘buenos aires’ emphasizing Carlos Reutemann’s win on home soil. These word clouds collectively highlight the diversity and story of Formula 1 Grands Prix stories, showcasing the elements that make each Grand Prix special and add more stories to the world of F1.
Conclusion
The best performing drivers of all time since the 1950s are Lewis Hamilton, Michael Schumacher, and Fernando Alonso respectively (Figure 1). The best performing constructors of all time are Ferrari, McLaren, and Williams (Figure 2). In the current 2024 World Championship, Max Verstappen seems to be in the lead with 255 points (based on dataset; not up-to-date), Lando Norris in 2nd place with 171 points, and Charles Leclerc in 3rd place with 150 points (Figure 3). The importance of gaining points in F1 races is immensely important to winning championships in this motorsport.
Grand Prix locations over the history of F1 have taken place primarily over cities in Europe, with the highest number of races in Monza, Italy. Additionally, they have been held in several continents in North and South America, Australia, Africa, and Asia (Figure 4). Specifically, the networks panel show that the most popular hosts and destinations for Grand Prix races are the UK, France, Spain, Germany, Italy, Belgium, and Monaco. In general, the most popular pairing was from the UK to France, closely followed by Spain and Monaco.
Additionally, by presenting key elements in a visually pleasing and engaging manner, the word clouds not only celebrate the rich history of F1 but also provide a deeper understanding of what makes each race unique. Whether you’re an old fan or a new one, these word clouds can bring you stories about the world Formula 1 to life, painting a complete picture for you to see, observe and learn from.
Limitations
Limitations of this project include the fixed state of the dataset. The current data does not reflect live data, so as more races have been taking place, the updated data would have to be manually updated. Hence, the data in some of the visualizations (e.g Figure 3) are not entirely accurate since they do not reflect real-time data. A possible extension would to use an F1 API with live/real-time data, however, the ones we looked at were limited as they only had data from recent years (e.g 2023 onward).
In addition, the results extracted from some of the visualizations (e.g Figure 4) mainly apply to the general population as the target audience of this blog project is a general audience of people who may not be familiar with Formula 1. Hence, a possible extension is to include visualizations that might inform those that are already fans or knowledgeable about the basics of the world of F1 and how it works (e.g comparing results of sprint qualifying races in relation to Grand Prix or difficulty of circuits versus lap times)
For the networks, a limitation present due to the nature of ggraph and simpleNetwork are the lack of user input that was possible through Shiny. While the complete network in Figure 5 is complicated to follow without careful investigation, it is still valuable to observe the general flow of circuits.
As for the word clouds, while they offer a quick overview of prominent terms and news at a given time in the F1 world and are visually appealing, there are some limitations. First, they focus solely on word frequency, often ignoring the context and relationships between words, which can lead to oversimplifications. For example, a word like “tyre” in one cloud may not convey the detailed nuances of why tyres were significant in that particular race (Figure 8). Additionally, the design of word clouds may obscure less frequent but equally important terms. To address these limitations, a potential addition would be to complement the word cloud(s) with other text analysis methods like sentiment analysis, or even direct narrative explanations, as done in this project. By combining word clouds with richer forms of analysis, we can preserve their visual charm while providing a deeper understanding of the reception surrounding F1 news/events.
References
Allaire, J. J., Gandrud, C., Russell, K., and Yetman, C. (2017), networkD3: D3 JavaScript network graphs from r.
Briatte, F. (2024), Ggnetwork: Geometries to plot networks with ’ggplot2’.
Cheng, J. (2010-2011), leaflet: Show/hide layers.
Cheng, J. (2010-2011), leaflet: Popups and labels.
Cheng, J., Schloerke, B., Karambelkar, B., and Xie, Y. (2024), Leaflet: Create interactive web maps with the JavaScript ’leaflet’ library.
CODER, R. (2024), R CHARTS: Ranking with ggwordcloud in r.
Documentation, R. (2020), Sample: Random samples and permutations.
Le Pennec, E., and Slowikowski, K. (2024), Ggwordcloud: A word cloud geom for ’ggplot2’.
Pedersen, T. L. (2024), Ggraph: An implementation of grammar of graphics for graphs and networks.
Rao, R. (2020), “Formula 1 world championship 1950-2020 dataset,” Dataset, Available at https://www.kaggle.com/datasets/rohanrao/formula-1-world-championship-1950-2020/data?select=constructor_standings.csv.
Sievert, C. (2020), Interactive web-based data visualization with r, plotly, and shiny, Chapman; Hall/CRC.
Silge, J., and Robinson, D. (2016), “Tidytext: Text mining and analysis using tidy data principles in r,” JOSS, The Open Journal, 1. https://doi.org/10.21105/joss.00037.
Wickham, H. (2024), Rvest: Easily harvest (scrape) web pages.
Wickham, H., Averick, M., Bryan, J., Chang, W., McGowan, L. D., François, R., Grolemund, G., Hayes, A., Henry, L., Hester, J., Kuhn, M., Pedersen, T. L., Miller, E., Bache, S. M., Müller, K., Ooms, J., Robinson, D., Seidel, D. P., Spinu, V., Takahashi, K., Vaughan, D., Wilke, C., Woo, K., and Yutani, H. (2019), “Welcome to the tidyverse,” Journal of Open Source Software, 4, 1686. https://doi.org/10.21105/joss.01686.